- Balance Sheets
At December 31(Millions of yen)
| Consolidated | |||||
|---|---|---|---|---|---|
| 2021 | 2022 | 2023 | 2024 | 2025 | |
| ■Assets | |||||
| Current assets | 7,988 | 9,249 | 9,778 | 10,017 | 11,529 |
| Fixed assets | 11,611 | 11,318 | 11,038 | 10,848 | 10,913 |
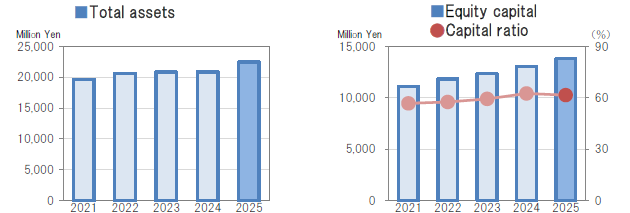
| Total assets | 19,600 | 20,568 | 20,817 | 20,866 | 22,443 |
| ■Liabilities | |||||
| Current liabilities | 4,108 | 4,410 | 4,322 | 4,127 | 5,204 |
| Fixed liabilities | 4,021 | 4,338 | 4,142 | 3,702 | 3,441 |
| Total liabilities | 8,487 | 8,749 | 8,464 | 7,830 | 8,646 |
| ■Net assets | |||||
| Shareholders’ equity | 11,109 | 11,644 | 12,122 | 12,673 | 13,336 |
| Other comprehensive income | △8 | 174 | 230 | 362 | 460 |
| Total net assets | 11,113 | 11,818 | 12,352 | 13,035 | 13,797 |
| Total liabilities and net assets | 19,600 | 20,568 | 20,817 | 20,866 | 22,443 |
*The Company began preparing consolidated financial statements in the fiscal year to December, 2014 to include SIAM KOKEN LTD. as part of business operations.
- Capital ratio
At December 31(Millions of yen)
| consolidated * | |||||
|---|---|---|---|---|---|
| 2021 | 2022 | 2023 | 2024 | 2025 | |
| Total assets | 19,600 | 20,568 | 20,817 | 20,866 | 22,443 |
| Equity Capital | 11,113 | 11,818 | 12,352 | 13,035 | 13,797 |
| (Capital ratio) | (56.7%) | (57.5%) | (59.3%) | (62.5%) | (61.5%) |
* The Company began preparing consolidated financial statements in the fiscal year to December, 2014 to include SIAM KOKEN LTD. as part of business operations.
(Note)This website is not made for solicitation of investment. If you do plan to invest, please do not make an investment decision by solely relying on the information published in this website and use your own judgment before investing.
Although KOKEN has implemented all possible means to ensure the accuracy of the content of this website, KOKEN is not liable or responsible in any way for any damages, losses, or costs that may be caused as a result of using this site, including but not limited to damages caused by the use of information or incorrect information posted in this website, and any problems resulting from the downloading of data, for whatever the reason.