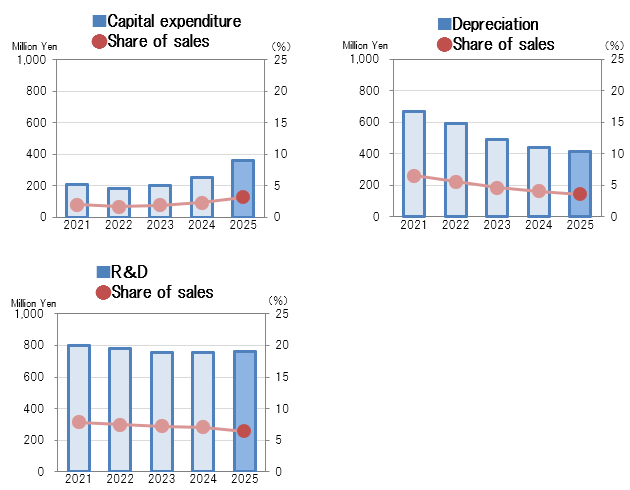
- Capital expenditure, Depreciation and R&D
Years ended December 31(Millions of yen)
| Consolidated | |||||
|---|---|---|---|---|---|
| 2021 | 2022 | 2023 | 2024 | 2025 | |
| Sales | 10,203 | 10,604 | 10,587 | 10,762 | 11,857 |
| Capital expenditure (% of sales) |
206 (2.0%) |
182 (1.7%) |
199 (1.9%) |
249 (2.3%) |
362 (3.1%) |
| Depreciation0 (% of sales) |
666 (6.5%) |
594 (5.6%) |
490 (4.6%) |
441 (4.1%) |
416 (3.5%) |
| R&D (% of sales) |
799 (7.8%) |
779 (7.4%) |
757 (7.2%) |
753 (7.0%) |
762 (6.4%) |
* The Company began preparing consolidated financial statements in the fiscal year to December, 2014 to include SIAM KOKEN LTD. as part of business operations.
(Note) Information on forecasts on business outcomes, business strategies, and other information relating to the future that is contained within the website reflects judgments by officers of the company that were made based on information currently available and assumptions that were judged reasonable. Therefore, please note that business outcomes and progress in business strategies could vary from forecasts if the business environment has changed.
This website is not made for solicitation of investment. If you do plan to invest, please do not make an investment decision by solely relying on the information published in this website and use your own judgment before investing.
Although KOKEN has implemented all possible means to ensure the accuracy of the content of this website, KOKEN is not liable or responsible in any way for any damages, losses, or costs that may be caused as a result of using this site, including but not limited to damages caused by the use of information or incorrect information posted in this website, and any problems resulting from the downloading of data, for whatever the reason.